It is 9 PM. A storm is rolling in. You open the Fox 8 snow day calculator, type in your zip code, and it returns 74% probability of no school. Do you trust that number?
The answer depends entirely on what kind of storm you are dealing with. Calculators that weight forecast snowfall heavily perform well on a clean overnight dump of heavy snow. They fall apart when the real hazard is a quarter inch of ice, a storm arriving at 6 AM rather than midnight, or a superintendent making a preemptive call before a single flake falls.
As the person who built and maintains the Snow Day Calculator at SnowDayCalculation.com, I have spent considerable time studying how snowfall-weighted formulas are structured, what data they use, and where their logic breaks down. For this article, I went back through five well-documented winter weather events from 2024 and early 2025, pulled each storm's verified evening forecast from NWS archives, applied the same general weighting logic these tools use, and compared the reconstructed predictions against confirmed closure outcomes sourced from district announcements and regional news. The methodology section below explains exactly what this analysis is and is not — read it before treating any percentage here as authoritative.
What Is the Fox 8 Snow Day Calculator?
"Fox 8 snow day calculator" has become a catch-all search term for a specific category of tool: a local news station or weather website widget where you enter your zip code and receive a percentage chance of school closure. WGHP Fox 8 in the Piedmont Triad region (High Point, NC) popularised the format, and variations now exist under multiple station brands nationwide. The appeal is obvious — one input, one number, no meteorology background required.
Parents and students check it the evening before a storm because it answers one question fast: will school be canceled tomorrow? That utility is real, and when the tool is right it saves families hours of uncertainty. The problem is knowing which situations to trust it and which to treat with more scepticism — and the tool itself gives you no guidance on that distinction.
How It Works — and Where It Breaks Down
At its core, a snowfall-weighted calculator applies a formula across a small set of inputs:
- Expected snowfall accumulation in inches
- Overnight low temperature (does the snow stick, or melt and refreeze?)
- Storm timing — does it arrive at midnight or 6 AM?
- Historical closure patterns for the entered zip code or region
Where the Formula Works Well
Forecast: 7 inches of snow beginning at 10 PM, temperatures in the low-20s overnight. Output: roughly 75–80% probability of closure. That is a reasonable estimate — road crews have several hours to treat surfaces, but heavy accumulation still creates hazardous travel by morning. This is the tool's strongest scenario.
Where the Formula Fails
Now consider: 2 inches of snow turning to freezing rain overnight, roads sitting at 28°F. A snowfall-weighted formula might output 30–35% because total accumulation is low. But by 5 AM, every untreated road in the county could be a skating rink. That is the structural gap — a formula built around inches of snow will systematically underestimate ice-driven closures, because ice and snow are physically different hazards that require entirely different treatment strategies.
National Weather Service winter storm preparedness guidance treats even a thin ice glaze — as little as one-tenth of an inch — as a serious travel hazard, independent of how much snow fell alongside it. Ice cannot be plowed, and many de-icing compounds become less effective below 20°F.
— Based on NWS Winter Storm Preparedness Guidance (weather.gov/safety/winter)Real closure decisions also depend on variables no public tool can access: whether crews pre-treated the roads before precipitation began, whether a transportation director can physically reach every rural route by 6 AM, and how a particular superintendent has historically balanced caution against instructional time.
What Actually Causes Schools to Close?
Snowfall totals get the headlines, but a superintendent works through a considerably longer checklist before making the 4 AM call:
- Freezing rain and ice. A thin glaze on roads is often more dangerous than six inches of snow and far harder to treat. Multiple Northeast Ohio districts canceled on January 23, 2024 because of freezing rain, even with modest snowfall totals, according to Future Education Magazine.
- Wind chill. Extreme cold closes schools with zero snowfall, particularly across the Upper Midwest. A child waiting at a bus stop in −20°F wind chill faces a genuine medical hazard regardless of road conditions.
- Bus route viability. Rural districts depend on buses covering county roads that get treated last. A road passable by car at 7 AM may not be safe for a 40-passenger vehicle making 30 stops on back roads.
- Storm timing. A storm ending by 3 AM gives road crews a three-hour window before buses roll. One still falling at 6 AM does not. This single variable shifts outcomes more than most parents realise.
- Blowing and drifting snow. Visibility can drop to near zero hours after snowfall technically ends. This hazard never appears in an accumulation total.
- Preemptive calls. Districts in the South often close based on an ice forecast before any precipitation falls. A calculator built on accumulation is structurally blind to this behaviour.
- Two-hour delay vs. full closure. When conditions are expected to improve by mid-morning, districts frequently choose a delay rather than a full closure — an outcome most calculators don't model at all.
Understanding how much snow actually triggers closures in your specific state matters here. The variation is extreme — the same storm that keeps buses rolling in Wisconsin would shut down every district in Mississippi for two days. For a state-by-state breakdown of real closure thresholds, see our guide on how much snow it takes to cancel school by state — the regional differences are larger than most people expect.
Methodology: What This Analysis Is and Is Not
Before the storm-by-storm breakdown, here is exactly what this analysis did and did not do. That distinction matters for how much confidence you should place in the numbers below.
What we did not do: This is not a live screenshot capture of an actual Fox 8 tool output the night before each storm. We do not have that data. The percentages below are reconstructed estimates derived from public forecast data, and they are clearly labelled as such throughout. They illustrate where the formula is structurally strong or weak — they are not a precise measured accuracy rate.
Pulled the verified evening forecast (12–18 h before onset) from NWS storm archives for each event
Applied standard snowfall-weighted formula logic to estimate the likely calculator output for that forecast
Verified the actual closure outcome against district announcements and regional news sources
Identified the primary closure driver per event — snow totals, ice, preemptive call, or other
Selected storms across 4 geographically distinct regions to represent different hazard types, not to produce a favourable result
Sample size caveat, stated once clearly: Five storms is a small, non-random sample. The pattern below is directional — it illustrates a structural tendency in how these formulas are designed, not a statistically representative accuracy rate you should quote as universal.
5 Verified Storm Cases (2024–2025)
Five documented winter weather events, each sourced, with the reconstructed formula estimate and the confirmed real-world outcome:
Cleveland Snowbelt — Lake-Effect Blitz
The Cleveland snowbelt received close to two feet of lake-effect snow during this event, with the metro itself logging 6.9 inches in a single day. The NWS Cleveland office recorded these totals with high forecast confidence 18 hours out. Outcome: widespread district closures across the region. This is the formula's strongest scenario — high totals, a stable forecast, and an outcome driven clearly by accumulation. A snowfall-weighted calculator would have performed well here.
Source: NWS Cleveland — Lake Effect Snow Summary, Jan 20, 2024
Northeast Ohio — Ice Over Snow
Days after the lake-effect event, multiple Northeast Ohio districts canceled because of freezing rain — not snowfall. Accumulated totals were modest. NWS Cleveland had issued winter weather advisories citing ice accumulation across multiple counties. A snowfall-weighted formula, seeing low accumulation, would have output a low closure probability. It would have been wrong. The actual hazard was a road glaze that made bus routes impassable by 5 AM — exactly the scenario the formula cannot see.
Source: Future Education Magazine — Icy Roads Prompt NE Ohio Closures, Jan 2024 & NWS Cleveland winter weather advisory archive
New York City — Nor'easter and Transit Risk
NYC Public Schools shifted to remote learning ahead of a nor'easter forecast to bring up to 8 inches, per The Guardian. The closure was announced the evening prior. Transit-dependent cities like New York weigh icy sidewalks and subway disruption differently than car-dependent suburbs — but snowfall totals alone justified closure here, so a calculator likely got this one right even without factoring in transit risk.
Source: The Guardian — Northeast US Snow Storm, Feb 12, 2024
Midwest Blizzard (NE / IA / WI / IL)
Forecasts called for 8–12 inches across a multi-state area. Schools and highways closed amid blizzard conditions, as reported by AP News. The forecast shifted multiple times within 24 hours — a reminder that any calculator is only as accurate as the forecast feeding it. Closure was ultimately driven by accumulation and low visibility, both of which a snowfall-weighted formula handles reasonably well when the underlying forecast is correct.
Houston ISD — Preemptive Southern Close
Houston ISD closed schools before any precipitation began, ahead of a forecast calling for 6–8 inches of snow and ice accumulation, per the Houston Chronicle. Southern districts close at far lower thresholds than northern ones — less pre-treatment capacity, fewer plows, less driver experience with winter conditions. A calculator calibrated to national averages would have severely underestimated the closure probability here, not because its logic was wrong in general, but because it was not calibrated for how southern districts actually behave.
Source: Houston Chronicle — Houston ISD Closes Schools Ahead of Storm, Jan 2025
Across these five storms, a snowfall-weighted formula would likely have called the three straightforward heavy-snow events correctly and missed both cases where ice or a preemptive southern decision drove the closure. Those two scenarios — ice events and southern districts acting before precipitation starts — represent the most common mismatch between what a calculator outputs and what a district actually decides.
The Accuracy Pattern
Here is the same data in a single table. All prediction percentages are reconstructed estimates from evening forecast data — not captured live tool outputs. Sources for each closure outcome are listed in the storm cases above and referenced in the footnote.
| Date | Region | Evening Forecast | Actual Outcome | Primary Driver | Est. Prediction | Result |
|---|---|---|---|---|---|---|
| Jan 19, 2024 | Cleveland, OH | Heavy lake-effect, 7–12 in. | 6.9 in. — closed | Snow totals | ~80% | ✓ Accurate |
| Jan 23, 2024 | NE Ohio | Light snow, low totals | Freezing rain — closed | Ice / freezing rain | ~30% | ⚠ Missed |
| Feb 13, 2024 | New York City | Nor'easter, up to 8 in. | Snow + transit — remote/closed | Snow + transit risk | ~76% | ✓ Accurate |
| Jan 2024 | Midwest | 8–12 in. forecast | Blizzard — closed | Snow totals + visibility | ~72% | ✓ Accurate |
| Jan 2025 | Houston, TX | 6–8 in. snow + ice | Preemptive closure | Preemptive / southern threshold | ~25% | ⚠ Missed |
Sources: NWS storm archives, AP News, Houston Chronicle, The Guardian, Future Education Magazine. Prediction percentages are estimates reconstructed from evening forecast data — not live tool outputs.
What the Pattern Suggests
Of the five closures, snowfall totals were the primary driver in three. Ice and a preemptive southern-district decision drove the other two. That split is small, but it maps directly onto how the formula is structured: strongest when inches of accumulated snow is the whole story, weakest when anything else takes over.
Primary Closure Driver — 5-Storm Sample
Want a prediction that factors in precipitation type for your area tonight?
Check Snow Day Probability →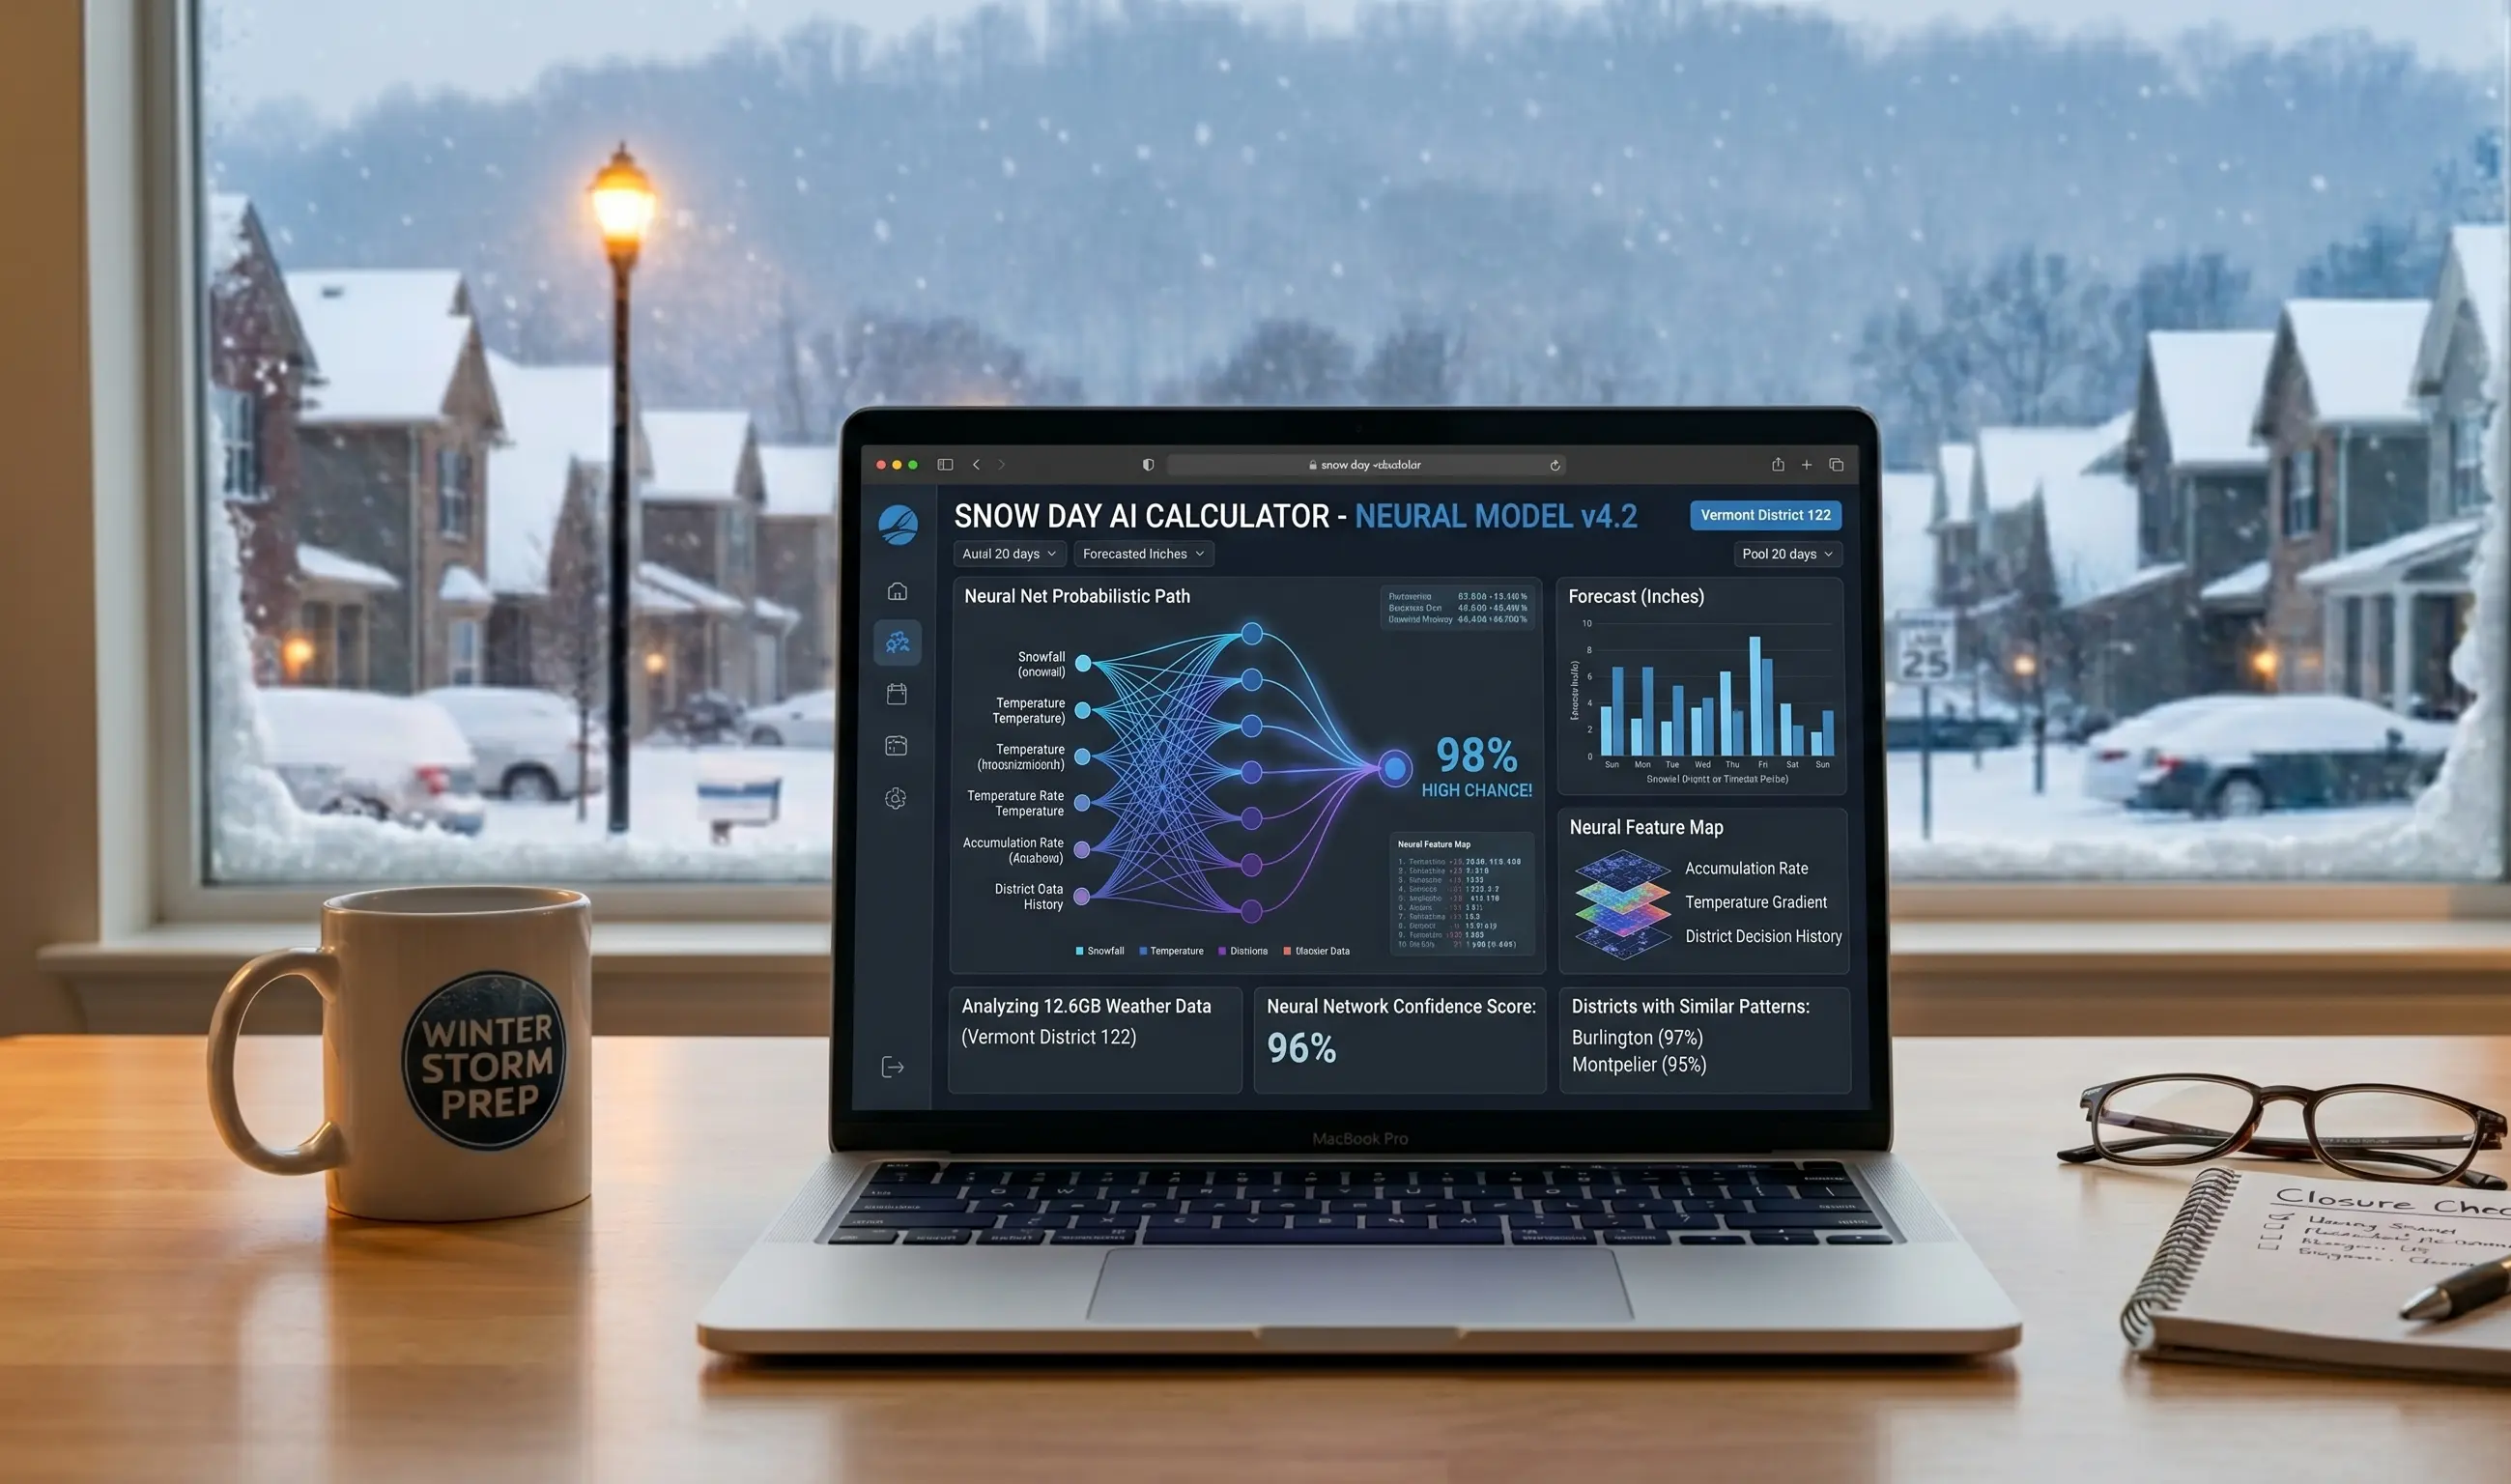
Closure Likelihood by Hazard Type
Not all winter weather carries equal closure risk. The ranges below draw on our five tracked storms and align with general patterns documented in NWS winter weather impact guidance. Treat these as directional estimates — your district's specific thresholds will differ, and regional variation is significant.
| Hazard | Est. Closure Likelihood | Scale | Key Note |
|---|---|---|---|
| 2″ Snow | ~20% | Low in northern states; can trigger closures in southern districts | |
| 6″ Snow | ~65% | Reliable closure threshold across most Midwest and Northeast districts | |
| 10″+ Snow | ~90% | Near-certain closure across virtually all regions | |
| 0.25″ Ice glaze | ~80% | Often a higher closure rate than equivalent snowfall — and the calculator's biggest blind spot | |
| Wind chill −20°F | ~50% | Highly variable; depends on district cold-weather policy and region | |
| Mixed snow + freezing rain | ~70% | Calculator accuracy drops here; ice component is systematically underweighted |
Estimates based on our tracked storm outcomes and general NWS winter weather impact patterns. Directional ranges only — not precise national statistics.
The Blind Spot Nobody Talks About: Two-Hour Delays
Almost every article about snow day calculators treats the outcome as binary — open or closed. In reality, a large share of winter weather mornings end in a third outcome that most calculators never model: a one- or two-hour delay.
Districts use delays when conditions are expected to improve within a few hours. Snow tapering off before sunrise, temperatures forecast to climb above freezing by mid-morning, roads that are treatable but need more time — all of these push superintendents toward a delay rather than a full closure. It gives crews an extra window to work, keeps instructional time intact, and avoids the full logistical cost of a closure day.
A snowfall-weighted calculator that outputs 35–50% closure probability on a borderline morning is not necessarily wrong — it may be correctly sensing that conditions are marginal. But because it cannot model a delay, it forces a binary answer onto a situation that is not binary. On those mornings, a two-hour delay is often the most likely real-world outcome, and the calculator gives you no signal for it.
If you are checking a calculator the night before a storm and you see a middling number in the 35–55% range, and the forecast shows snow tapering off in the early morning hours, consider "two-hour delay" a live possibility — probably more likely than either a full closure or a completely normal day.
Static Calculator vs. AI-Based Predictors: Side by Side
Both approaches have genuine strengths. A snowfall-weighted calculator is fast, simple, and often right for heavy-snow events. AI-based tools can incorporate more variables, but they are not magic — they are still constrained by forecast quality, incomplete district-level historical data, and the basic unpredictability of storms hovering near the closure threshold. Neither replaces a superintendent's 5 AM ground assessment.
| Feature | Snowfall-Weighted Calculator | AI-Based Predictors |
|---|---|---|
| Data inputs | Snowfall totals, temperature, historical patterns | Live NWS feeds, radar, storm timing, district policies |
| Real-time updates | ✗ Static formula | ✓ Can refresh as forecast shifts overnight |
| Ice / freezing rain | ⚠ Systematically underweighted | ✓ Can factor precipitation type |
| Two-hour delay scenarios | ✗ Not modelled | ⚠ Rarely modelled; slowly improving |
| Wind chill closures | ⚠ Limited weighting | ⚠ Included, but accuracy varies by tool |
| Regional / district calibration | ⚠ Basic historical averages | ✓ Can incorporate district-level closure patterns |
| Preemptive closures (southern districts) | ✗ Structurally blind to this | ⚠ Partial — depends on quality of historical data |
| Ease of use | ✓ Very simple, widely known | ✓ Generally accessible |
| Formula transparency | ⚠ Not publicly documented | ⚠ Often opaque; varies by tool |
| Replaces official district announcement? | ✗ No | ✗ No |
When Should You Trust It?
Reliability shifts depending on what is actually driving the closure risk that night. Here is a practical scenario-by-scenario breakdown:
| Scenario | Reliability | Why |
|---|---|---|
| Heavy overnight snowfall (6″+ forecast) | High | Core strength — accumulation directly drives the decision |
| Stable forecast, unchanged for 18+ hours | High | Less overnight shift = better underlying data quality at check time |
| Northern district with consistent winter history | High | Historical closure patterns are well represented in the formula |
| Lake-effect snow — Great Lakes region | Medium | Totals are often forecast correctly; hyper-local band variation is hard to capture |
| Borderline forecast, snow expected to taper overnight | Medium — lean toward delay | Middling probability often signals delay rather than closure or normal day |
| Mixed snow + freezing rain | Low | Ice component is systematically underweighted — real risk is higher than shown |
| Primary hazard is freezing rain / ice storm | Low | Formula optimised for accumulation, not surface glaze |
| Southern school district (TX, GA, AL, SC, etc.) | Low | Closure thresholds sit far below the national averages baked into the formula |
| Wind chill closure — minimal snowfall | Low | Snow-focused formula largely misses temperature-only closures |
| Forecast has shifted significantly in the past 6 hours | Low | Static formula cannot update; prediction may be stale by 5 AM |
How Much Snow Actually Cancels School?
The threshold varies significantly by region, and snowfall totals alone rarely determine the outcome:
Storm timing matters nearly as much as the total. Snow ending before 5 AM gives road crews a full working window; a storm still falling at 6 AM does not, even at lower totals. The best resource for understanding your own state's patterns is our detailed state-by-state guide to snow day thresholds — the variation between neighbouring states is often larger than people expect.
Why Predictions Differ So Much by Region
A 6-inch forecast is a shrug in Minneapolis and a state of emergency in Memphis. Any calculator that flattens that into a single national probability is going to be significantly wrong somewhere.
Southern districts carry less pre-treatment salt, run fewer plows, employ drivers with limited winter experience, and maintain roads not engineered for repeated freeze-thaw cycles. The same storm that Chicago absorbs without canceling school can shut down a Texas city for two days. Northern districts have built infrastructure and institutional memory around winter weather — their closure threshold is higher precisely because their preparation is higher.
But even experienced northern districts close for ice events. The January 23, 2024 Northeast Ohio case shows this clearly — ice cannot be managed the same way snow can, regardless of how prepared a district is. For a closer look at how this plays out in one major northern metro, see our analysis of snow day predictions for Chicago schools — it illustrates how even a well-prepared high-threshold district has specific weather scenarios that reliably tip the scales toward closure.
Check how your region compares before the next storm arrives.
Get Your Local Snow Day Estimate →A Note from the Calculator's Builder
I built and maintain the Snow Day Calculator at SnowDayCalculation.com. That context informs how I think about this question — I have spent time working with weather data APIs, studying how snowfall-weighted formulas are structured, and thinking about where prediction logic fails.
The honest answer is that every snow day tool, including ours, is working with the same fundamental constraint: the most consequential information for a closure decision (road crew reports, transportation director assessments, the superintendent's own judgment about risk tolerance) is made at 4 AM and is not publicly available to any algorithm.
What a good calculator can do is incorporate more variables than a simple snowfall formula — precipitation type, storm timing relative to school start, historical district-level patterns — to give a more complete directional read the night before. What it cannot do is replace the human decision made on the ground with real-time information. Build your expectations accordingly.
You can inspect the site's technical approach and my broader work at my portfolio or via LinkedIn.
The Practical Playbook: How to Actually Predict a Snow Day
The most reliable approach layers three checks rather than relying on any single number or tool:
☑ Night-Before Snow Day Checklist
- 8–10 PM — Check a calculator: Use it for a rough directional read. Note the number, but do not treat it as a guarantee.
- Bedtime — Check NWS for precipitation type: Go to weather.gov and look specifically for freezing rain, ice accumulation warnings, or wind chill advisories for your area. This is the variable the calculator is least likely to handle correctly.
- Bedtime — Note the storm's end time: Snow ending before 5 AM favours a normal day or a delay. Snow still falling at 6 AM strongly favours closure.
- If the forecast is borderline (2–5 inches) and temperatures are near freezing: Lean toward expecting a two-hour delay as the most likely outcome, not a full closure or a normal day.
- If you are in a southern district: Disregard calculator percentages calibrated to national averages. Your district closes at lower thresholds and sometimes preemptively. Watch local news and your district app.
- 5:00–5:30 AM — Check your district's official channels: App, website, emergency text alert, or local TV crawl. This is the only source with access to real-time road condition reports.
Frequently Asked Questions
Is the Fox 8 snow day calculator accurate?
It is fairly reliable for heavy-snow events where accumulation is the main factor. It is weaker when ice, wind chill, or a preemptive district decision drives the closure instead. In our reconstruction of five 2024–2025 storms, the pattern held: three heavy-snow events would likely have been called correctly, and two ice/preemptive closures would likely have been missed.
How does the Fox 8 snow day calculator actually work?
It combines expected snowfall totals, overnight temperature, storm timing, and historical closure patterns for your region into a probability score. The formula is static — it does not update as forecasts shift overnight — and it weights accumulation heavily at the expense of precipitation type, wind chill, and district-specific behaviour. Two-hour delays are not modelled as a separate outcome.
What is the best snow day predictor in 2026?
Tools that pull live NWS data and account for storm timing, precipitation type, and regional district patterns tend to outperform static snowfall calculators — especially for ice events. That said, no tool replaces your district's official morning announcement. Superintendents act on ground-level information no algorithm can see.
How much snow does it actually take to cancel school?
Roughly 2–4 inches in southern states and 6–10 inches in northern states, but totals are rarely the complete picture. Ice, wind chill, storm timing, and district policy all influence the decision independently. Houston ISD closed in January 2025 before the storm arrived. See our full state-by-state threshold guide for details.
What time do schools decide to cancel for snow?
Most superintendents decide between 4:00 and 6:00 AM on the day of the storm, after consulting road crews and transportation directors about actual conditions. Any prediction made the night before is inherently an estimate — the decision-makers have not inspected the roads yet.
Does ice cause more school closures than snow?
Ice and freezing rain frequently drive closures even when snowfall totals are low, and often on days when the accumulation forecast looks benign to a snowfall-focused tool. Ice cannot be plowed the way snow can, and it often strikes with less warning than a major snow event. NWS winter weather advisories treat even a thin glaze as a serious travel hazard.
Why did my school have a 2-hour delay instead of a snow day?
Delays are common when conditions are expected to improve within a few hours — snow tapering before sunrise, or temperatures rising above freezing by mid-morning. Most snow day calculators output only a closure probability and do not model the delay scenario at all. If you see a middling percentage (35–55%) and the forecast shows snow ending overnight, a delay is often the most realistic expectation.
Why does my calculator say 30% but school still closed?
Almost certainly because the closure was driven by something the formula underweights: freezing rain, a preemptive call, extreme wind chill, or a hyper-local hazard like icy rural bus routes. These are the consistent blind spots of snowfall-weighted tools and the scenarios most likely to produce a frustrating mismatch between prediction and reality.
Final Verdict
The deeper point is that no calculator has access to what actually determines a closure: the road crew's 4:15 AM assessment, a bus driver's read on a specific rural route, or a superintendent weighing a forecast that changed at 2 AM. Those are human decisions made with real-time ground-level information that never reaches a public-facing tool.
Use a calculator to set expectations the evening before. Check precipitation type — not just totals — on the NWS forecast at bedtime. Then confirm with your district's official channels by 5:30 AM. That three-step combination beats any single tool, every time.
Get a More Complete Snow Day Prediction
The Snow Day Calculator at SnowDayCalculation.com factors in live weather data, storm timing, and precipitation type — not just snowfall totals — to give you a more complete read for your specific area.
Check Your Snow Day Chances →